
Instructor
Alan Barefield
662.312.0874 (cell)
alan.barefield@gmail.edu
Additional Resources
- BRE and Chat GPT – Amanda Carlson – This guide was developed by Amanda Carlson (Temple Economic Development Corporation). Amanda developed this guide to provide some suggestions regarding how generative artificial intelligence could be used in a BR&E program.
- Steps in a BRE Program
- Competitiveness in Rural U.S. Regions: Learning and Research Agenda – Michael Porter, Christian H.M. Ketels, Kaia Miller, and Richard T. Bryden
- BRE Marketing Flyer – Matthew Trask, Western Regional Enterprise Network
- MS Economic Council – Securing Mississippi’s Future – Vision for Economic Growth
- BRE Program Contacts
- The World Cafe “Focus Group” Method
“Homework” Questions for Online Courses
- BR&E Program Planning Homework – Section 3
- Social Capital Homework – Section 5
- Survey Analysis Homework – Section 11
- Overall Program Description Homework – Section 14
Class Presentations
- 01 Coordinating-a-Business-Retention-and-Expansion-Visitation-Program –
- Business-Retention-and-Expansion-Plan RZ version 2
- LEADS BRE Presentation
Pre-Course Resources
- Halifax Partnership – BRE Program Manual
- Halifax Partnership – BRE Training Workshop
- Tweeten and Barefield – cd1605 – Volunteer Visitor Manual
- Tweeten and Barefield – cd1605a – Appendices
- Barefield and Tweeten – Sources of Secondary Socio-Economic Data
- Theodori – Preparing for the Future
- University of Wisconsin Extension – Logic Models for Program Evaluation
Section 1 – Introduction
- Acknowledgments
- Instructor Biography
- Participant List
- BREI Fundamentals Course – Course Objectives
- Course Agenda
- Course Assignment
- Section 1 – Why a Course and BR&E
Section 2 – BR&E Models
- Section 2 – BR&E Introduction
- BRE Program Flowchart
- Introduction to BRE Models
- BEAR in Benalla video
Section 3 – Introduction to Program Planning
- Section 3 – Intro Program Planning
- SMART Goals Definitions
- Halifax Sample Key Performance Indicator Overview
- Planning Model Examples
Fundamentals Course Homework – Session 1
Section 4 – Community Assessment
- Section 4 – Community Assessment
- Choctaw Nation Materials
- Mandan Community Profile
- Oktibbeha County Census Profile (2010-2020)
- Oktibbeha County Economic Profile
- Oktibbeha County Health Economics Profile
- Oktibbeha County Poverty and Well-being Profile
- Oktibbeha County Veterans Affairs Spending Profile
- Oktibbeha County Retail Economics Profile
- Oktibbeha County Economic Contribution of Agricultural Sales Profile
- Starkville Retail Economics Analysis Profile
- Starkville Retail Economics Comparison Profile
- Halifax Index 2023
Data Sources and Examples
Specific Data for Class Participants
- Lightcast (formerly Emsi) Occupations and Industry Jobs
- Lightcast data
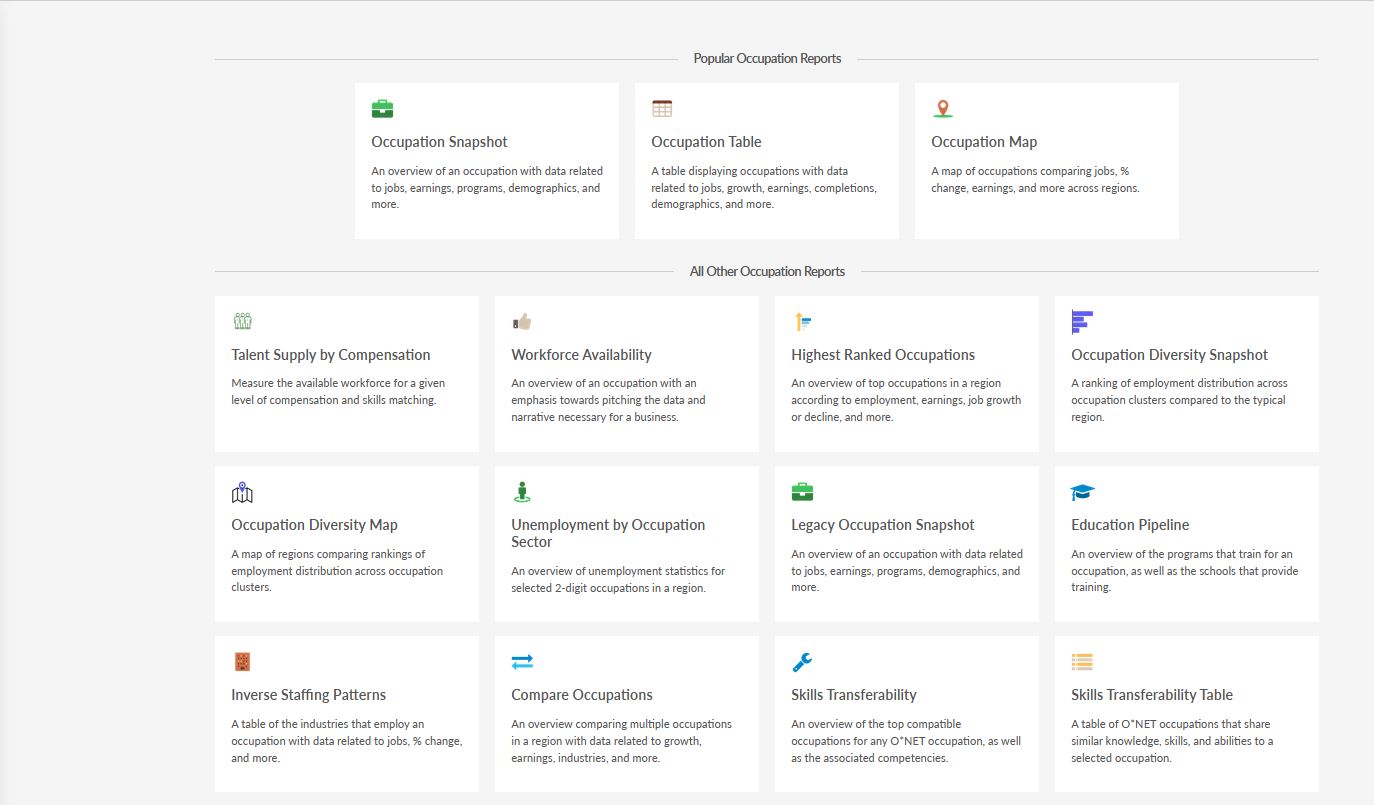
- The following screen shots show the range of reports, data, and maps that can be extracted from the Emsi proprietary database. The only limit that I have for downloading these reports/data is the time that it takes (it may take me some time to get to them and send them to you).
- Industry Reports

- Occupation Reports
- Input Output Reports

- Industry Reports
- These reports are general reports that provide an overview of the region that is selected
- The following screen shots show the range of reports, data, and maps that can be extracted from the Emsi proprietary database. The only limit that I have for downloading these reports/data is the time that it takes (it may take me some time to get to them and send them to you).
- Esri data
- The following reports are the Tapestry Segmentation reports.
- The following is a list of the different types of reports that can be generated for a specific region. Please realize that I am limited to the number of reports that I can generate in a specific time period, so I cannot generate all of these reports just because you would like to see them. However, if you think that you have a need for a few of these reports, let me know and I’ll generate them for you.
- Census Profile; Housing Profile; Population Summary; Age 50+ Profile; Age by Sex by Race Profile; Age by Sex Profile; Automotive Aftermarket Expenditures; Business Locator; Business Summary; Community Profile; Crime Summary; Demographic and Income Comparison Profile; Demographic and Income Profile; Detailed Age Profile; Disposable Income Profile; Dominant Tapestry Map; Electronics and Internet Market Potential; Executive Summary; Finances Market Potential; Financial Expenditures; Graphic Profile; Health and Beauty Market Profile; House and Home Expenditures; Household Budget Expenditures; Household Income Profile; Housing Profile; Major Shopping Center Locator; Major Shopping Center Map; Market Profile; Medical Expenditures; Net Worth Profile; Pets and Products Market Potential; Recreation Expenditures; Restaurant Market Potential; Retail Demand Outlook; Retail Goods and Services Expenditures; Retail Market Potential; Site Details Map; Site Map; Site Map on Satellite Imagery – 0.4 Miles Wide; Site Map on Satellite Imagery – 0.8 Miles Wide; Site Map on Satellite Imagery – 1.6 Miles Wide; Sports and Leisure Market Potential; Tapestry Segmentation Area Profile; Times Series Profile; Traffic Count Map; Traffic Count Map – Close Up; Traffic Count Profile
Section 5 – Social Capital
Fundamentals Course Homework – Session 2
Section 6 – Roles of Local Leaders
- Section 6 – Roles of Local Program Leaders
- Pounding the Pavement
- Indicators that a Community is Ready for the BRE Process
- Plan of Work Discussion Questions
- Asset Mapping Guide
- Competitiveness in Rural U.S. Regions – Michael Porter
Section 7 – Survey Design and Implementation
- Section 7 – Survey Design
- Survey Sample Size Calculator
- Choctaw Nation Survey Resources (Blane-Canada, Ltd.)
- Nova Scotia Retention Survey – updated
- Nova Scotia_Retention Survey Notes
- Choctaw Nation of Oklahoma Main BRE Survey Instrument
- Ocean Grove BEAR Business Questionnaire
- Other Survey Resources
Section 8 – Visitation Training
- Section 8 – Firm Visitation
- University of Minnesota Extension BR&E Visitation Video (new video)
- Firm Visitor Tips and Procedures
- Guidelines for Firm Visitors
- Role Play Notes Appendix
- Charlottesville OED Confidentiality Guidelines
- Nova Scotia REN Informed Consent
- Nova Scotia REN Nondisclosure Agreement
- University of Minnesota Firm Visitation Video (old video)
- The first 7:30 of this video reveals tips on setting up the interview and recording responses for a BR&E visit. While these tips are primarily geared to a Volunteer Visitor program, they can be very useful in the Continuous or Segregated approaches particularly for economic professionals new to the BR&E process.
Section 9 – Red Flag Review
- Section 9 – Red Flag Review
- Flag Review Procedures
- Flag Followup Worksheet
- Appendix F – Follow-up Suggestions and Flags
- BREI Red Flag Example Survey
Section 10 – Survey Analysis and Reports
- Section 10 – Survey Analysis and Report
- Open Ended Survey Question Analysis Example
- Example Report – Brenham TX Business COVID-19 Survey Final Report
- Example Report – Barefield – COVID 19 BRE Round 2 Survey Results – Final Report
- Example Report – Lonsdale Summary Report
- SWOT Worksheet
- Research Report Checklist
- Questions for Report Writers
- Analyzing Survey Data – National Business Research Institute
- Morgan – Problems in the Analysis of Survey Data
- Leahy – Using Excel for Analyzing Survey Questionnaire
- Approaches to the Analysis of Survey Data – University of Reading
The following link is a report by Eric Canada and Tyler Baines of the Center for Regional Competitiveness (CREC). With the demise of the e-Synchronist software, CREC felt that it would be of service to examine other software packages that could be oriented to BR&E efforts and provide a synopsis of the features that these packages could provide. The companies that agreed to be interviewed are listed in alphabetical order and no rating is provided.
Canada and Baines – Economic Development Software Review
Fundamentals Course Homework – Session 3
Open Ended Survey Question Analysis – Barefield
Section 11 – Action Team Planning
Section 12 – Program Evaluation
- Section 12 – Program Evaluation
- University of Wisconsin Extension Logic Model Guide
- SMART Goals Definitions
- Sibley County BR&E Evaluation Results PowerPoint
Section 13 – Community Input and Implementation
- Section 13 – Community Input Celebration Implementation
- How Successful are Business Retention and Expansion Implementation Efforts?
- Tishomingo County Development Foundation
- 2023 Tishomingo County EDC Annual Report
- Site Selection – https://siteselection.com/digitaledition/
Section 14 – Special Topics in BR&E
- Section 14 – BRE Special Topics
- Business Retention and Expansion (BRE): A Practical Approach to Economic Development (Community Development – Current Issues Series) 1st Edition
- Corona Virus
-
Business Retention and Expansion (BRE): A Practical Approach to Economic Development
- Darger Barefield Hales – Business retention and expansion BRE today
- Darger Tuck Bennett – Lessons learned
- Morgan Morphis – Defining success in business retention and expansion
- Templin Chazdon Muske Barroso Osborne Craig – The silver tsunami and rural small business retention
- Bowen-Ellzey Romich – Energize job retention Energy management strategies
- Zhang Warner – Business retention and expansion and business clusters
